This domain is for sale. If interested, please, contact us at pelhrimov[AT]yahoo.com for more details.
Lorenz Curve
Lorenz Curve
The Lorenz Curve is a graphical representation of the proportionality of a distribution. It represents a probability distribution of statistical values, and is often associated with income distribution calculations and commonly used in the analysis of inequality.
The population in the Lorenz curve is represented as households and plotted on the x axis from 0% to 100%. The income is plotted on the y axis and is also from 0% to 100%.
For example, a Lorenz curve can show that the bottom 50% of households bring in 35% of a country's income.
The Lorenz Curve model was developed by economist Max Lorenz in 1905.
How the Lorenz curve is constructed?
To build the Lorenz curve, all the elements of a distribution must be ordered from the most important to the least important.
Then, each element is plotted according to their cumulative percentage of X and Y, X being the cumulative percentage of elements and Y being their cumulative importance.
For instance, out of a distribution of 10 elements (N), the first element would represent 10% of X and whatever percentage of Y it represents (this percentage must be the highest in the distribution).
The second element would cumulatively represent 20% of X (its 10% plus the 10% of the first element) and its percentage of Y plus the percentage of Y of the first element.
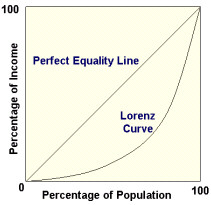
Perfect Equality Line
If income distribution were perfectly equal, 20% of households would generate 20% of income, 50% of households would generate 50% of income, 72% of households would generate 72% of income, and so on. This situation where each element has an equal value in its shares of X and Y, that is a linear relationship, is called the perfect equality line, and would be equal to the Lorenz curve.
The perfect inequality line represents a distribution where one element has the total cumulative percentage of Y while the others have none.For instance, in a distribution of 20 elements, if there is perfect equality, the 10th element would have a cumulative percentage of 50% for X and Y.
The perfect equality line forms an angle of 45 degrees with a slope of 100/N.
Gini coefficient
The Gini coefficient is another way to measure equity and is derived from the Lorenz curve.
The Gini coefficient is defined graphically as a ratio of two surfaces involving the summation of all vertical deviations between the Lorenz curve and the perfect equality line (A) divided by the difference between the perfect equality and perfect inequality lines (A+B).
If the area between the line of perfect equality and Lorenz curve is A, and the area under the Lorenz curve is B, then the Gini coefficient is A/(A + B).
Limitation of Lorenz curve
The amount of inequality may be misleading. If richer households are able to use their incomes more efficiently than lower income households, the amount of inequality could be understated.
When comparing two Lorenz curves, it is not possible to determine which distribution has more inequality if the two curves intersect.
An individual’s income varies over his lifetime, and this variation is
not considered when analyzing inequality using a Lorenz curve. Lorenz curve ignores life cycle effects.
Robin Hood Index
What is Robin Hood Index and how it relates to the Lorenz curve?
You can find that on the page with the Robin Hood Index.
.
Discuss this article or this topic in our discussion forum:
(The table bellow shows a list of 8 most recent topics posted in our discussion forum. Visit our discussion forum to see more. It is possible the links below are not related to this page, but you can be certain you will find related posts in the discussion forum. You can post one yourself too.)
Email this article to a friend:
.
How can I link to this web page?
It is easy, just include the code provided below into your HTML code.
 Delicious
 Digg
Digg StumbleUpon
 Furl
Furl Facebook
 Google
 Yahoo
Yahoo
Maxi-Pedia
Search Maxi-Pedia
Interesting Topics
Favorite Topic
More Details
Selected Topics
Maxi RSS Feeds


