This domain is for sale. If interested, please, contact us at pelhrimov[AT]yahoo.com for more details.
Phillips Curve
Phillips Curve
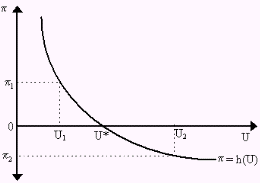
The Phillips Curve is a graphical representation of the inverse, or negative, economic relationship between the rate of unemployment (or more precise, the rate of change in unemployment) and the percentage rate of change in money wages.
The Phillips Curve charts a historical regularity in which unemployment and inflation are negatively correlated. That is, the main concept of the Phillips curve is that a low inflation and low unemployment are incompatible; therefore, governments have to choose the best combination of both.
Phillips also suggested that at an unemployment rate of 2.5 per cent and stable wages could be maintained.
The Phillips curve is named after British economist Alban William Phillips (1914-1975).
The Phillips curve in the real world
During the early 1960s, it was generally believed that monetary policy could exploit a stable trade-off between the level of inflation and the unemployment rate.
William Phillips described the Phillips curve theory in 1958 using U. K. data from 1861-1957. He demonstrated that policymakers could permanently lower the unemployment rate by generating higher inflation.
On the other hand, economists Edmund Phelps (1967) and Milton Friedman (1968) argued a few years later that a trade-off between inflation and employment described by the Phillips curve is only a short term relationship.
They suggested that once people came to expect the higher inflation, monetary policy could not keep the unemployment rate permanently below its equilibrium.
This theory was later experienced in the 1970s when rising U.S. inflation did not bring about the lower unemployment rates suggested by the Phillips curve.
The Phillips curve today
The Phillips curves for most modern economies no longer look the way they did in 1960.
Modern monetary policy has improved so inflation is relatively stable, and the curve (for the US) has been almost horizontal since the mid-1980s.During the second half of the 1990s, the U. S. economy exhibited low and falling inflation combined with low and falling unemployment. It was the exact opposite of what the Phillips curve says.
This was attributed to the growth in worker productivity. The Phillips curve assumes constant worker productivity.
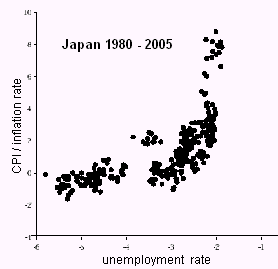
If we look at the Phillips curve in Japan, it no longer looks like the original Phillips curve. The economic relationship between the rate of unemployment (or more precise, the rate of change in unemployment) and the percentage rate of change in money wages is positive.
.
Discuss this article or this topic in our discussion forum:
(The table bellow shows a list of 8 most recent topics posted in our discussion forum. Visit our discussion forum to see more. It is possible the links below are not related to this page, but you can be certain you will find related posts in the discussion forum. You can post one yourself too.)
Email this article to a friend:
.
How can I link to this web page?
It is easy, just include the code provided below into your HTML code.
 Delicious
 Digg
Digg StumbleUpon
 Furl
Furl Facebook
 Google
 Yahoo
Yahoo
Maxi-Pedia
Search Maxi-Pedia
Interesting Topics
Related Topics
Favorite Topic
More Details
Selected Topics
Maxi RSS Feeds


