This domain is for sale. If interested, please, contact us at pelhrimov[AT]yahoo.com for more details.
Internal-External (IE) Matrix
Internal-External (IE) Matrix
The Internal-External (IE) matrix is another strategic management tool used to analyze working conditions and strategic position of a business. The Internal External Matrix or short IE matrix is based on an analysis of internal and external business factors which are combined into one suggestive model.
The IE matrix is a continuation of the EFE matrix and IFE matrix models.
How does the Internal-External IE matrix work?
The IE matrix belongs to the group of strategic portfolio management tools. In a similar manner like the BCG matrix, the IE matrix positions an organization into a nine cell matrix.
The IE matrix is based on the following two criteria:
- Score from the EFE matrix -- this score is plotted on the y-axis
- Score from the IFE matrix -- plotted on the x-axis
The IE matrix works in a way that you plot the total weighted score from the EFE matrix on the y axis and draw a horizontal line across the plane. Then you take the score calculated in the IFE matrix, plot it on the x axis, and draw a vertical line across the plane. The point where your horizontal line meets your vertical line is the determinant of your strategy. This point shows the strategy that your company should follow.
On the x axis of the IE Matrix, an IFE total weighted score of 1.0 to 1.99 represents a weak internal position. A score of 2.0 to 2.99 is considered average. A score of 3.0 to 4.0 is strong.
On the y axis, an EFE total weighted score of 1.0 to 1.99 is considered low. A score of 2.0 to 2.99 is medium. A score of 3.0 to 4.0 is high.
IE matrix example...
Let us take a look at an example. We calculated IFE matrix for an anonymous company on the IFE matrix page. The total weighted score calculated on this page is 2.79 which points at a company with an above-average internal strength.
We also calculated the EFE matrix for the same company on the EFE matrix page. The total weighted score calculated for the EFE matrix is 2.46 which suggests a slightly less than average ability to respond to external factors.
Now we plot these values on axes in the IE matrix.
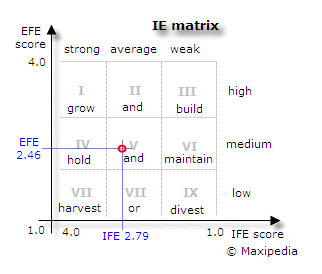
This IE matrix tells us that our company should hold and maintain its position. The company should pursue strategies focused on increasing market penetration and product development (more about this below).
What does the IE matrix tell me?
Your horizontal and vertical lines meet in one of the nine cells in the IE matrix. You should follow a strategy depending on in which cell those lines intersect.
The IE matrix can be divided into three major regions that have different strategy implications.
Cells I, II, and III suggest the grow and build strategy. This means intensive and aggressive tactical strategies. Your strategies should focus on market penetration, market development, and product development. From the operational perspective, a backward integration, forward integration, and horizontal integration should also be considered.Cells IV, V, and VI suggest the hold and maintain strategy. In this case, your tactical strategies should focus on market penetration and product development.
Cells VII, VIII, and IX are characterized with the harvest or exit strategy. If costs for rejuvenating the business are low, then it should be attempted to revitalize the business. In other cases, aggressive cost management is a way to play the end game.
What is the difference between the IE matrix and BCG matrix?
First, the IE matrix measures different values on its axes. The BCG matrix measures market growth and market share. The IE matrix measures a calculated value that captures a group of external and internal factors. This means that the IE matrix requires more information about the business than the BCG matrix.
While values for each axis in the BCG matrix are single-factor, values for each axis in the IE matrix are multi-factor figures.
Because the IE matrix is broader in its definition, strategists often develop both the BCG Matrix and the IE Matrix when assessing their conditions and formulating strategies.
Is the IE matrix forward-looking?
By default, both the BCG matrix and the IE matrix are constructed using factors related to current conditions. However, strategists often develop two sets of matrices -- a BCG Matrix and an IE Matrix for the current state and another set to reflect expectations of the future.
Is there any other management model related to IE matrix?
Yes, the IE matrix model can be developed into an even more analytical tool called the SPACE matrix.
Besides the IFE and EFE matrix, you might also be interested in reading about the SWOT matrix.
The Quantitative Strategic Planning Matrix (QSPM) model is the next step in strategic management decision making. This method can help if we need to decide between strategic alternatives.
.
Discuss this article or this topic in our discussion forum:
(The table bellow shows a list of 8 most recent topics posted in our discussion forum. Visit our discussion forum to see more. It is possible the links below are not related to this page, but you can be certain you will find related posts in the discussion forum. You can post one yourself too.)
Email this article to a friend:
.
How can I link to this web page?
It is easy, just include the code provided below into your HTML code.
 Delicious
 Digg
Digg StumbleUpon
 Furl
Furl Facebook
 Google
 Yahoo
Yahoo
Maxi-Pedia
Search Maxi-Pedia
Interesting Topics
Related Topics
Favorite Topic
More Details
Selected Topics
Maxi RSS Feeds


