This domain is for sale. If interested, please, contact us at pelhrimov[AT]yahoo.com for more details.
Quantitative Strategic Planning Matrix (QSPM)
Quantitative Strategic Planning Matrix (QSPM)
Quantitative Strategic Planning Matrix (QSPM) is a high-level strategic management approach for evaluating possible strategies. Quantitative Strategic Planning Matrix or a QSPM provides an analytical method for comparing feasible alternative actions. The QSPM method falls within so-called stage 3 of the strategy formulation analytical framework.
When company executives think about what to do, and which way to go, they usually have a prioritized list of strategies. If they like one strategy over another one, they move it up on the list. This process is very much intuitive and subjective. The QSPM method introduces some numbers into this approach making it a little more "expert" technique.
What is a Quantitative Strategic Planning Matrix or a QSPM?
The Quantitative Strategic Planning Matrix or a QSPM approach attempts to objectively select the best strategy using input from other management techniques and some easy computations. In other words, the QSPM method uses inputs from stage 1 analyses, matches them with results from stage 2 analyses, and then decides objectively among alternative strategies.
Stage 1 strategic management tools...
The first step in the overall strategic management analysis is used to identify key strategic factors. This can be done using, for example, the EFE matrix and IFE matrix.
Stage 2 strategic management tools...
After we identify and analyze key strategic factors as inputs for QSPM, we can formulate the type of the strategy we would like to pursue. This can be done using the stage 2 strategic management tools, for example the SWOT analysis (or TOWS), SPACE matrix analysis, BCG matrix model, or the IE matrix model.
Stage 3 strategic management tools...
The stage 1 strategic management methods provided us with key strategic factors. Based on their analysis, we formulated possible strategies in stage 2. Now, the task is to compare in QSPM alternative strategies and decide which one is the most suitable for our goals.
The stage 2 strategic tools provide the needed information for setting up the Quantitative Strategic Planning Matrix - QSPM. The QSPM method allows us to evaluate alternative strategies objectively.
Conceptually, the QSPM in stage 3 determines the relative attractiveness of various strategies based on the extent to which key external and internal critical success factors are capitalized upon or improved. The relative attractiveness of each strategy is computed by determining the cumulative impact of each external and internal critical success factor.What does a QSPM look like and what does it tell me?
First, let us take a look at a sample Quantitative Strategic Planning Matrix QSPM, see the picture below. This QSPM compares two alternatives. Based on strategies in the stage 1 (IFE, EFE) and stage 2 (BCG, SPACE, IE), company executives determined that this company XYZ needs to pursue an aggressive strategy aimed at development of new products and further penetration of the market.
They also identified that this strategy can be executed in two ways. One strategy is acquiring a competing company. The other strategy is to expand internally. They are now asking which option is the better one.
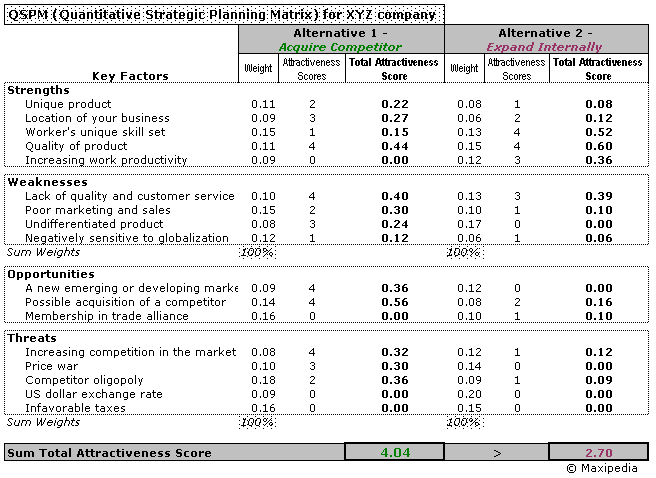
(Attractiveness Score: 1 = not acceptable; 2 = possibly acceptable; 3 = probably acceptable; 4 = most acceptable; 0 = not relevant)
Doing some easy calculations in the Quantitative Strategic Planning Matrix QSPM, we came to a conclusion that acquiring a competing company is a better option. This is given by the Sum Total Attractiveness Score figure. The acquisition strategy yields higher score than the internal expansion strategy. The acquisition strategy has a score of 4.04 in the QSPM shown above whereas the internal expansion strategy has a smaller score of 2.70.
How do I construct a QSPM?
You can see a sample Quantitative Strategic Planning Matrix QSPM above. The left column of a QSPM consists of key external and internal factors (identified in stage 1). The left column of a QSPM lists factors obtained directly from the EFE matrix and IFE matrix. The top row consists of feasible alternative strategies (provided in stage 2) derived from the SWOT analysis, SPACE matrix, BCG matrix, and IE matrix. The first column with numbers includes weights assigned to factors. Now let us take a look at detailed steps needed to construct a QSPM.
STEP 1...
Provide a list of internal factors -- strengths and weaknesses. Then generate a list of the firm's key external factors -- opportunities and threats. These will be included in the left column of the QSPM. You can take these factors from the EFE matrix and the IFE matrix.
Step 2...
Having the factors ready, identify strategy alternatives that will be further evaluated. These strategies are displayed at the top of the table. Strategies evaluated in the QSPM should be mutually exclusive if possible.
Step 3...
Each key external and internal factor should have some weight in the overall scheme. You can take these weights from the IFE and EFE matrices again. You can find these numbers in our example in the column following the column with factors.
Step 4...
Attractiveness Scores (AS) in the QSPM indicate how each factor is important or attractive to each alternative strategy. Attractiveness Scores are determined by examining each key external and internal factor separately, one at a time, and asking the following question:
Does this factor make a difference in our decision about which strategy to pursue?
If the answer to this question is yes, then the strategies should be compared relative to that key factor. The range for Attractiveness Scores is 1 = not attractive, 2 = somewhat attractive, 3 = reasonably attractive, and 4 = highly attractive. If the answer to the above question is no, then the respective key factor has no effect on our decision. If the key factor does not affect the choice being made at all, then the Attractiveness Score would be 0.
Step 5...
Calculate the Total Attractiveness Scores (TAS) in the QSPM. Total Attractiveness Scores are defined as the product of multiplying the weights (step 3) by the Attractiveness Scores (step 4) in each row.
The Total Attractiveness Scores indicate the relative attractiveness of each key factor and related individual strategy. The higher the Total Attractiveness Score, the more attractive the strategic alternative or critical factor.
Step 6...
Calculate the Sum Total Attractiveness Score by adding all Total Attractiveness Scores in each strategy column of the QSPM.
The QSPM Sum Total Attractiveness Scores reveal which strategy is most attractive. Higher scores point at a more attractive strategy, considering all the relevant external and internal critical factors that could affect the strategic decision.
Can I compare more than two strategies using a QSPM?
Yes, in general, any number of alternative strategies can be included in the QSPM analysis. We included only two alternatives in our example just to keep it simple. It is important to note that strategies subject to comparison should be mutually exclusive if possible.
I have questions about QSPM
You can ask your questions in our management discussion forum.
By the way, you might also be interested in reading about What is balanced Scorecard and Porter's Five Forces model.
.
Discuss this article or this topic in our discussion forum:
(The table bellow shows a list of 8 most recent topics posted in our discussion forum. Visit our discussion forum to see more. It is possible the links below are not related to this page, but you can be certain you will find related posts in the discussion forum. You can post one yourself too.)
Email this article to a friend:
.
How can I link to this web page?
It is easy, just include the code provided below into your HTML code.
 Delicious
 Digg
Digg StumbleUpon
 Furl
Furl Facebook
 Google
 Yahoo
Yahoo
Maxi-Pedia
Search Maxi-Pedia
Interesting Topics
Related Topics
Favorite Topic
More Details
Selected Topics
Maxi RSS Feeds


